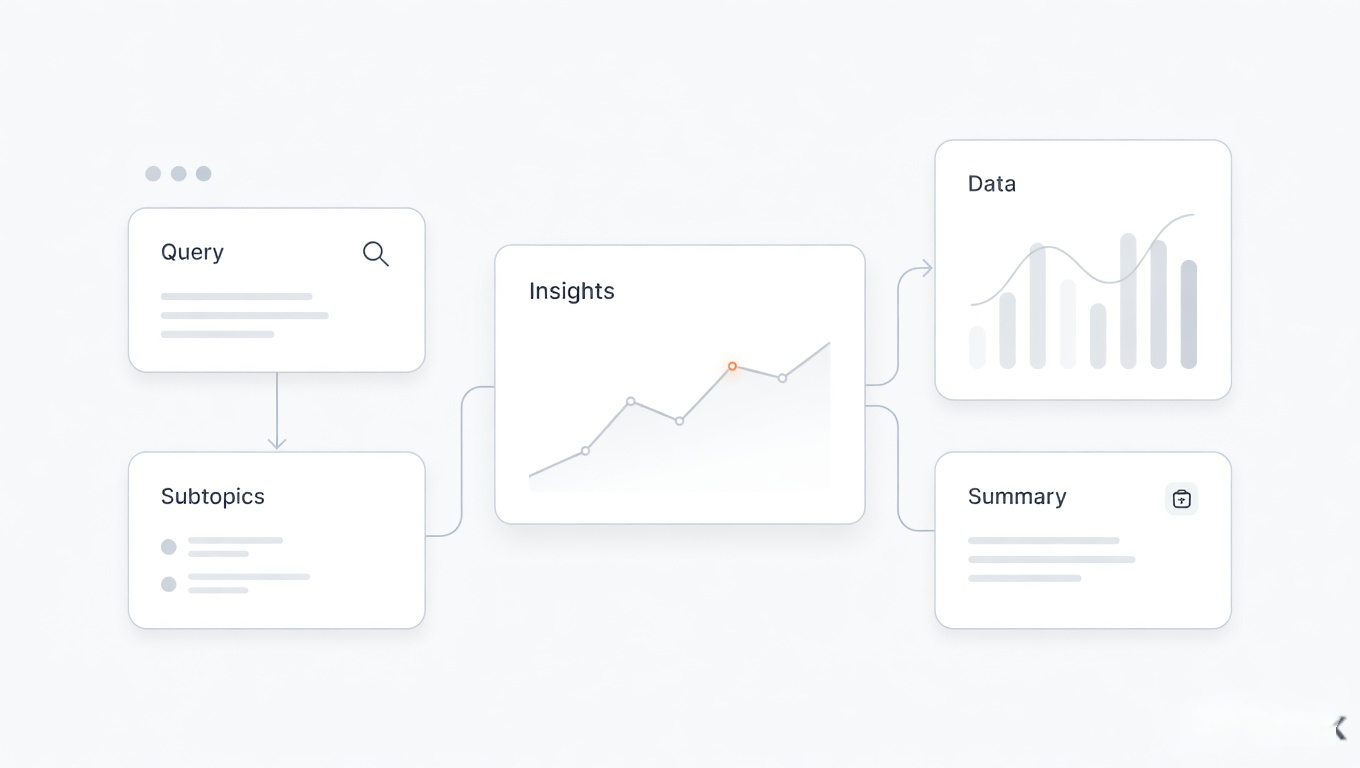
Market analysts rarely work from one clean source. A serious market question may require company pages, pricing data, industry reports, PDFs, spreadsheets, filings, news, and internal notes.
Rixx brings that evidence into one research workspace. Search the current web with citations, add the files that matter, compare findings through follow-up questions, create charts, and export the result as a shareable report.
Best for: market analysts, competitive-intelligence consultants, strategy teams, and independent researchers who need to show where their conclusions came from.
Market analysis is a mixed-source problem
A market report can become unreliable when the research process is split across too many tools.
You search the web in one tab. Important numbers sit inside PDFs. Competitor details go into a spreadsheet. Charts are made somewhere else. The final document contains conclusions, but the source trail is difficult to review.
Rixx is designed to keep those steps connected:
- cited web research for current market information;
- document and link analysis for supporting evidence;
- spreadsheet and Python-assisted analysis for structured data;
- charts, graphs, and Mermaid diagrams for visual explanation;
- contextual follow-up questions within the same research thread;
- PDF, Word, and Markdown outputs;
- shareable conversations for review.
Rixx does not replace analyst judgment. It helps organize the work that judgment depends on.
What market analysts can do with Rixx
Build a competitor landscape
Ask Rixx to identify relevant competitors, then define the comparison criteria that matter: segment, geography, pricing, positioning, product capabilities, customer type, distribution, or strategic direction.
Open the cited sources and verify important claims before adding them to a client or executive deliverable.
For a dedicated workflow, use the AI competitor analysis tool.
Compare pricing and positioning
Research public pricing pages, product documentation, company announcements, and third-party evidence. Ask follow-up questions to normalize differences between plans or packaging models.
The output can become:
- a pricing matrix;
- a positioning table;
- a segment map;
- a list of gaps and unresolved questions;
- a cited summary for decision-makers.
Always confirm price, currency, billing period, geography, and review date on the original page before publication.
Analyze reports and spreadsheets
Upload relevant PDFs, CSVs, or spreadsheets and ask Rixx to extract, compare, or visualize the information.
Examples include:
- turning a report table into a chart;
- comparing figures across several documents;
- exploring changes by category or period;
- finding discrepancies between a spreadsheet and a published source;
- creating a concise explanation of a larger dataset.
For document-based charts, use AI chart from PDF.
Create market maps and research briefs
Use the research thread to move from a broad question to a structured output.
A market brief might contain:
- scope and definitions;
- market structure;
- competitors and segments;
- demand or growth signals;
- pricing and business models;
- risks and evidence gaps;
- dated sources;
- implications and next questions.
Rixx can help prepare the structure and evidence. The analyst remains responsible for validating assumptions and deciding what the findings mean.
Turn findings into charts and reports
Research is more useful when another person can understand it.
Rixx can create charts, graphs, comparison tables, and Mermaid diagrams inside the workflow. Findings can then be exported as PDF, Word, or Markdown, or shared as a complete research conversation.
The important difference is continuity: the visual or report remains connected to the research process that produced it.
A practical market-analysis workflow
1. Define the decision
Start with the business decision, not a broad topic.
Weak question:
Research the cybersecurity market.
Stronger question:
Compare the positioning, public pricing, target customers, and key product differences of five endpoint-security platforms for a 500-person US company. Use current official product sources, note missing information, and separate facts from interpretation.
Specify:
- audience;
- geography;
- timeframe;
- category definition;
- comparison criteria;
- required output.
2. Gather current web evidence
Run cited web research and inspect the queries and sources. Prioritize primary evidence such as official pricing pages, filings, product documentation, regulatory sources, and direct company announcements.
Use secondary sources for context, not as automatic proof of a primary claim.
3. Add relevant files
Upload the reports, spreadsheets, presentations, or notes that should inform the analysis. Tell Rixx when an answer must be limited to uploaded evidence and when current-web evidence may be included.
4. Compare and challenge the findings
Ask follow-up questions:
- Which claims rely on only one source?
- Which numbers use different definitions or periods?
- Where do the sources disagree?
- What information is missing?
- Which conclusions are observations and which are interpretations?
5. Visualize only reviewed data
Create a chart after checking the labels, units, dates, and extracted values. A polished visual cannot repair unreliable data.
6. Export a reviewable asset
Generate a report, table, or chart and keep the citations visible. Export to the format required by the audience, then perform a final human review.
Example prompts for market analysts
Competitor comparison
Compare [companies] across target customer, positioning, public pricing, core product capabilities, and recent strategic announcements. Prefer official sources, cite every material claim, state the review date, and put unknown information in a separate column.
Market-entry scan
Build an initial market-entry brief for [product] in [country]. Cover market structure, customer segments, incumbent competitors, pricing signals, distribution constraints, regulation, and open questions. Separate sourced facts, estimates, and interpretation.
Report and spreadsheet analysis
Analyze the uploaded industry report and spreadsheet. Check whether the spreadsheet categories and totals match the report, identify discrepancies, and create a chart only from verified values. List every transformation used.
Evidence-gap review
Review the current analysis. Identify claims supported by one source, claims based on secondary reporting, conflicting figures, missing dates, and conclusions that need additional evidence.
Rixx compared with a generic chatbot
| Workflow need | Generic chatbot | Rixx research workspace |
|---|---|---|
| Current web research | Available in some products | Cited search is central to the workflow |
| Visible search process | Varies | Queries, steps, and sources remain visible |
| Uploaded reports and spreadsheets | Often available | Used alongside web evidence in the same thread |
| Charts and diagrams | Varies | Charts, graphs, Mermaid, and Python-assisted analysis |
| Exported deliverables | Varies | PDF, Word, and Markdown workflows |
| Research continuity | Chat-dependent | Follow-ups, memory, sharing, and reusable Skills |
The right choice depends on the task. General assistants are useful for broad writing and reasoning. Rixx is designed for research that must remain connected to evidence and become a reviewable asset.
Important limitations
Rixx is a research assistant, not a proprietary market-data terminal.
- It cannot guarantee that public sources are complete or correct.
- Paywalled or inaccessible information may not be available.
- Market-size figures often use incompatible definitions and should not be combined without review.
- Generated charts must be checked against their underlying data.
- Deep Research is coming soon; the current product supports user-directed cited research and follow-up exploration.
- Rixx should not be used as the sole basis for legal, financial, medical, or investment decisions.
Frequently asked questions
Can Rixx research current market information?
Yes. Rixx can search the current web and return source-backed answers with citations. Availability still depends on whether relevant pages are public and accessible.
Can I upload market reports and spreadsheets?
Yes. Supported documents, PDFs, spreadsheets, images, text files, and links can be added to the research context.
Can Rixx create competitor matrices?
Yes. You can define the competitors and criteria, gather cited evidence, and ask Rixx to structure the findings as a table or report. Verify each material claim before client use.
Can Rixx create charts from research?
Yes. Rixx supports interactive charts, static Python-backed charts, graphs, and Mermaid diagrams. Review source values, labels, units, and transformations before export.
Does Rixx replace a market analyst?
No. Rixx helps with discovery, organization, analysis, visualization, and output creation. An analyst must still define the question, evaluate source quality, resolve conflicting evidence, and make recommendations.
Can I export the final analysis?
Yes. Rixx supports PDF, Word, and Markdown outputs as well as full-chat sharing.
Keep the evidence attached to the analysis
Start with a real market question. Add the sources and files that matter. Check the evidence, create the visual, and export a result another person can review.