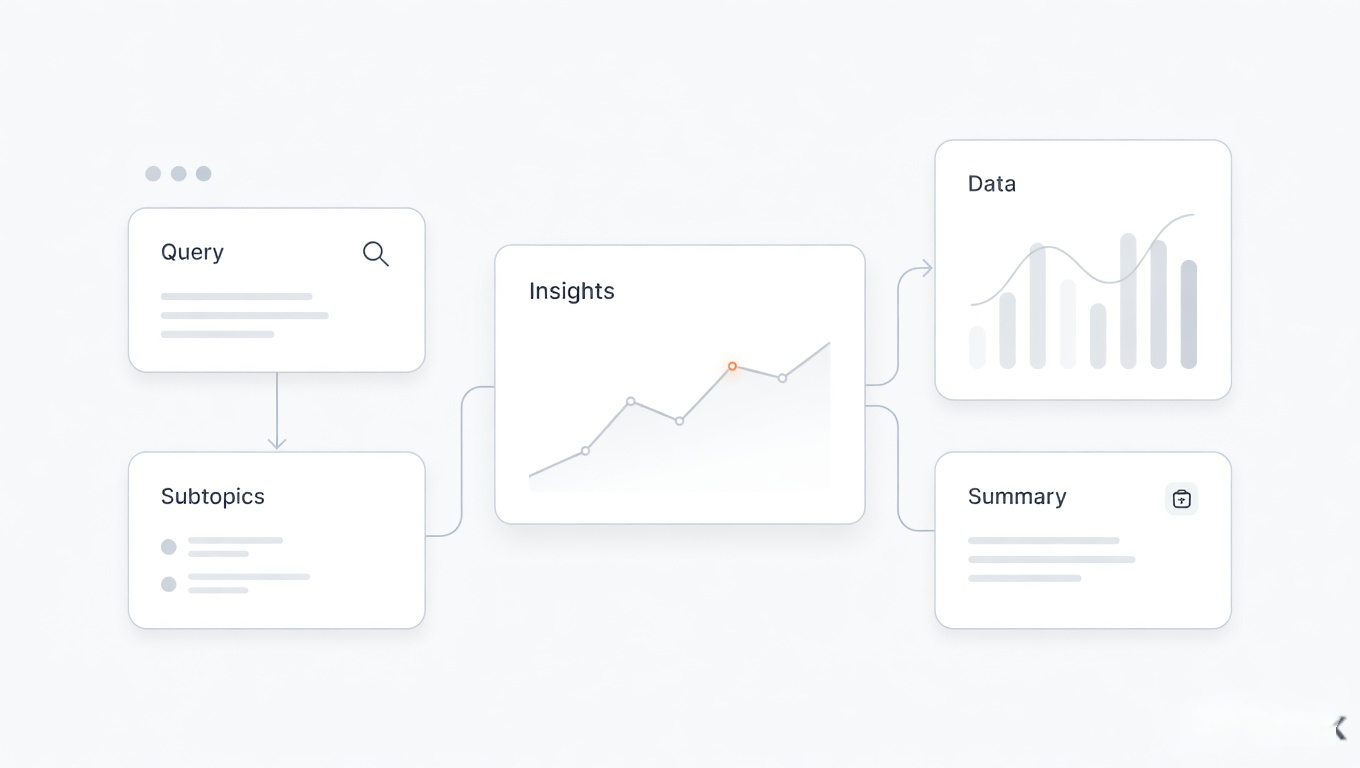
Upload a PDF, identify the table or figures you need, check the extracted values, and create a chart without separating the visual from its source.
Rixx supports document analysis, contextual follow-ups, Python-assisted data work, interactive or static charts, and exportable research outputs.
Why PDF-to-chart workflows fail
PDFs preserve layout, not clean data structure. A table may contain merged cells, footnotes, repeated headers, percentages, mixed units, or scanned text. An AI can produce a polished chart while still extracting a value incorrectly.
A dependable workflow must keep four things visible:
- the original document;
- the extracted values;
- any cleaning or transformation;
- the final chart.
Rixx keeps the document, conversation, analysis, and visual in the same research thread so you can review the full path.
What you can create
- Bar and column charts for category comparisons
- Line charts for time-series data
- Pie or donut charts when part-to-whole comparison is genuinely appropriate
- Scatter plots for relationships between numeric variables
- Tables for precise values
- Python-backed static charts
- Interactive charts for exploration
- Mermaid diagrams for non-numeric relationships
Choose the chart based on the question, not decoration.
How to create a chart from a PDF
1. Upload the PDF
Use a report, filing, paper, survey, or other supported document. If the PDF is scanned or visually complex, expect additional verification.
2. Identify the exact table or section
Specify the page, table, figure, headings, units, and period.
Example:
Extract the annual revenue values from Table 4 on pages 18–19. Preserve the reported currency and units. Show the extracted table before creating a chart.
3. Review the extracted data
Check:
- labels;
- numbers;
- decimal places;
- signs;
- percentages;
- units;
- currencies;
- dates;
- missing values;
- footnotes.
Do not proceed until the table matches the source.
4. Normalize only when necessary
If values require conversion, ask Rixx to list every transformation. Do not silently combine nominal and real values, monthly and annual figures, or different currencies.
5. Select the chart
State what the visual should help the reader understand. Rixx can then create an appropriate interactive or Python-backed chart.
6. Verify the final visual
Compare each plotted value with the reviewed table. Check axes, labels, legends, scales, and ordering.
7. Export or continue the research
Use the chart in a cited report, export the supporting document, or share the full conversation for review.
Example prompts
Extract before charting
Extract the values from the table on page 12. Return a clean table with original label, value, unit, period, and footnote. Do not create a chart until I approve the extraction.
Compare several PDFs
Extract the same metric from each uploaded report. Record the source, page, period, definition, and unit. Flag definition changes before creating a comparison chart.
Audit the chart
Compare the chart with the approved data table. Check every plotted value, axis label, unit, legend, and date. List any mismatch.
Good uses
- Annual-report trends
- Survey-result visualization
- Market-report comparisons
- Research-paper figures
- Pricing and benchmark tables
- Policy and regulatory reports
- Client-provided PDF analysis
Important limitations
- Scanned pages and complex layouts can produce OCR errors.
- Tables spread across pages may require manual reconstruction.
- Charts do not prove the source data is reliable.
- Statistical interpretation still requires domain judgment.
- Always review data transformations and chart scales.
- Rixx is not a replacement for audited financial, scientific, or regulatory analysis.
Frequently asked questions
Can Rixx extract a table from a PDF?
Yes, for supported PDFs. Extraction quality depends on document structure and scan quality, so review the table against the original.
Can it create charts from several PDFs?
Yes. First normalize definitions, units, currencies, and periods before comparing the values.
Does Rixx use Python for charts?
Rixx can use Python-backed analysis and create static charts, in addition to interactive chart workflows.
Can I edit the data before charting?
You can review and correct the extracted data through follow-up instructions before generating the visual.
Can I export the chart?
Rixx supports chart and generated-file workflows. Confirm the exact format required in the live interface.
Is the extracted data guaranteed to be accurate?
No. PDF extraction and AI-generated charts require human verification.
Create the chart and preserve the evidence
Start with the source, approve the data, then build the visual.